Data Visualization

Data Visualization

Data Visualization

Thales Insyte Portal Analytics Dashboard

Thales Insyte Portal Analytics Dashboard

Thales Insyte Portal Analytics Dashboard

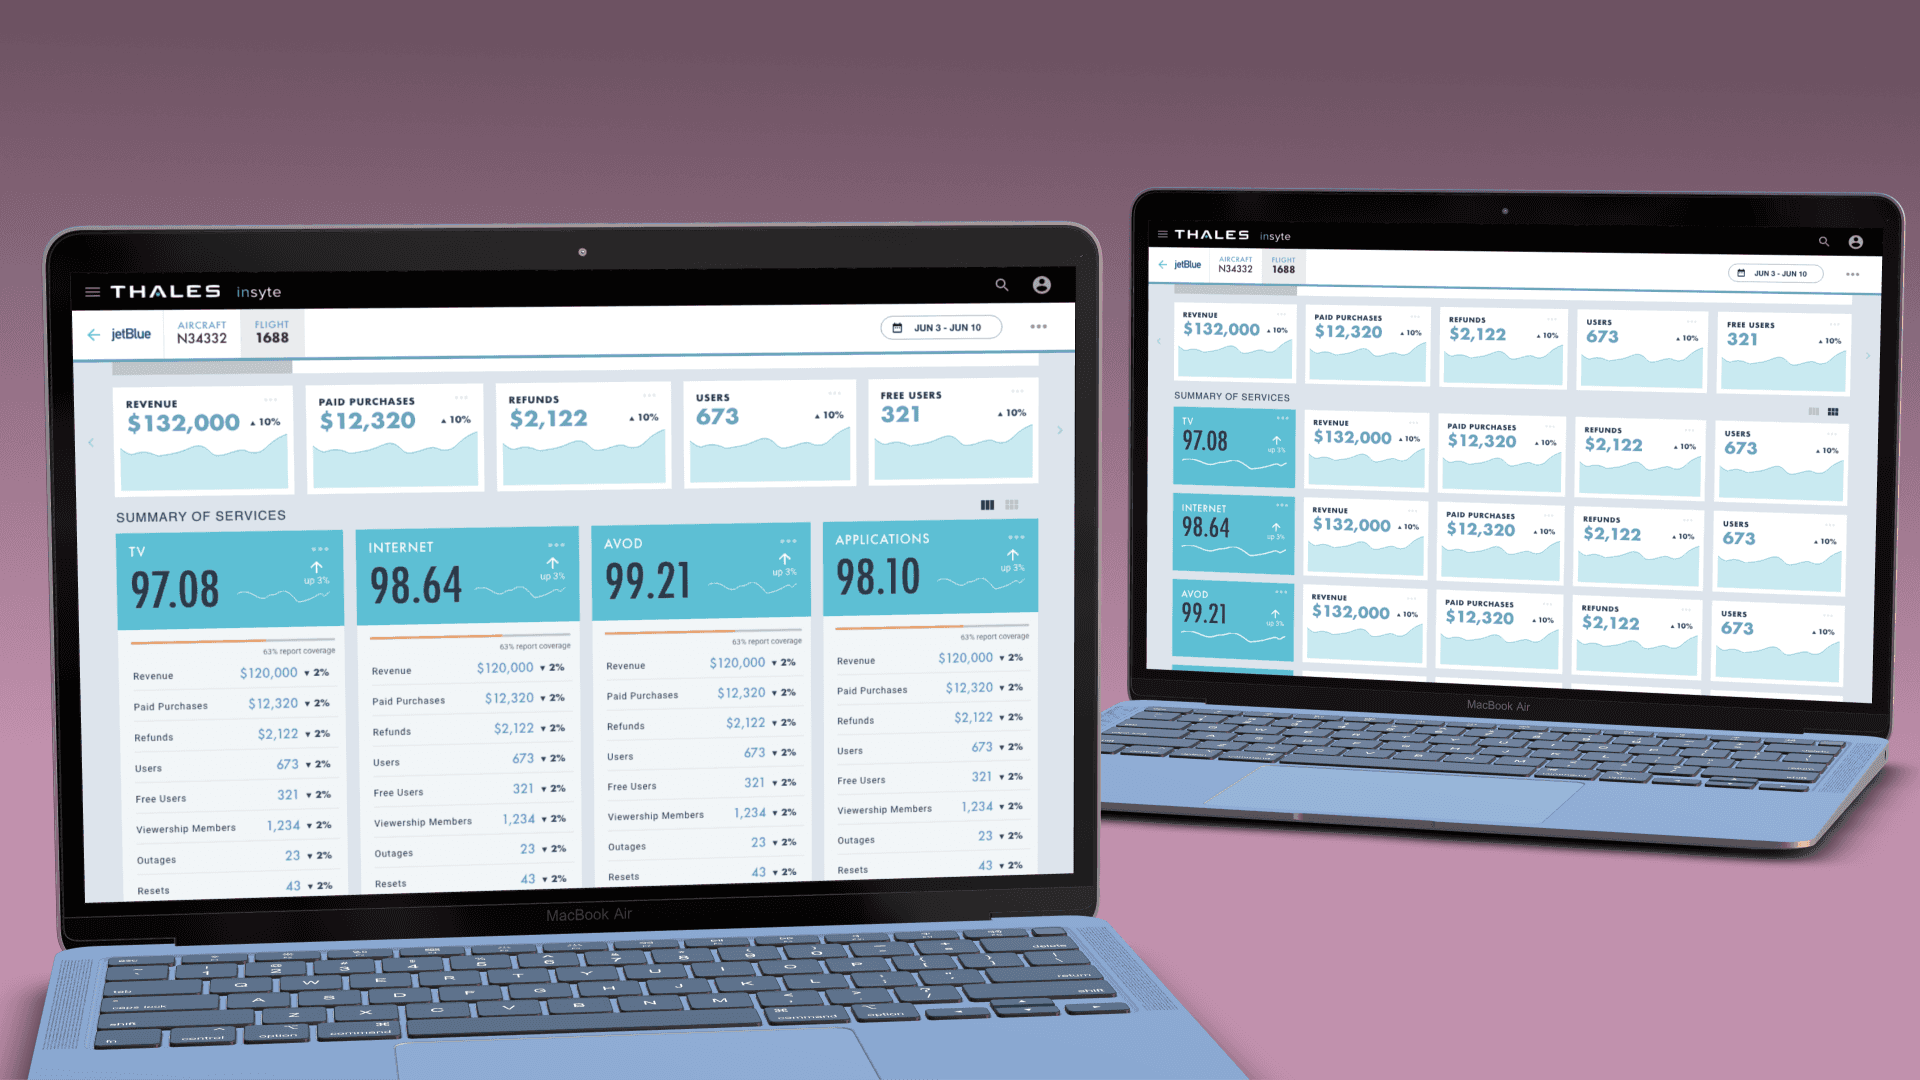
The Thales Insyte Portal Analytics Dashboard provides comprehensive insights into airline fleet connectivity systems, covering services like TV, Internet, AVOD, and applications. Designed for system administrators, it offers clear performance metrics and customizable views to manage specific flights or fleets efficiently.

Toggle between panel and grid views to display the most relevant information for users.

Toggle between panel and grid views to display the most relevant information for users.

Toggle between panel and grid views to display the most relevant information for users.

Drill down into detailed metrics using drawers and tabs for efficient data access.

Drill down into detailed metrics using drawers and tabs for efficient data access.

Drill down into detailed metrics using drawers and tabs for efficient data access.

Tabbed navigation allows easy access to complex data while maintaining clarity.

Tabbed navigation allows easy access to complex data while maintaining clarity.

Tabbed navigation allows easy access to complex data while maintaining clarity.

Netflix UI-inspired navigation provides intuitive, seamless performance data management.

Netflix UI-inspired navigation provides intuitive, seamless performance data management.

Netflix UI-inspired navigation provides intuitive, seamless performance data management.

Real-time alerts notify administrators of critical issues for prompt response.

Real-time alerts notify administrators of critical issues for prompt response.

Real-time alerts notify administrators of critical issues for prompt response.

Monitor overall system performance with detailed metrics on revenue, engagement, and availability.

Monitor overall system performance with detailed metrics on revenue, engagement, and availability.

Monitor overall system performance with detailed metrics on revenue, engagement, and availability.

Key Features

  • Performance Monitoring: Track real-time health across TV, Internet, AVOD, and more with detailed KPIs.

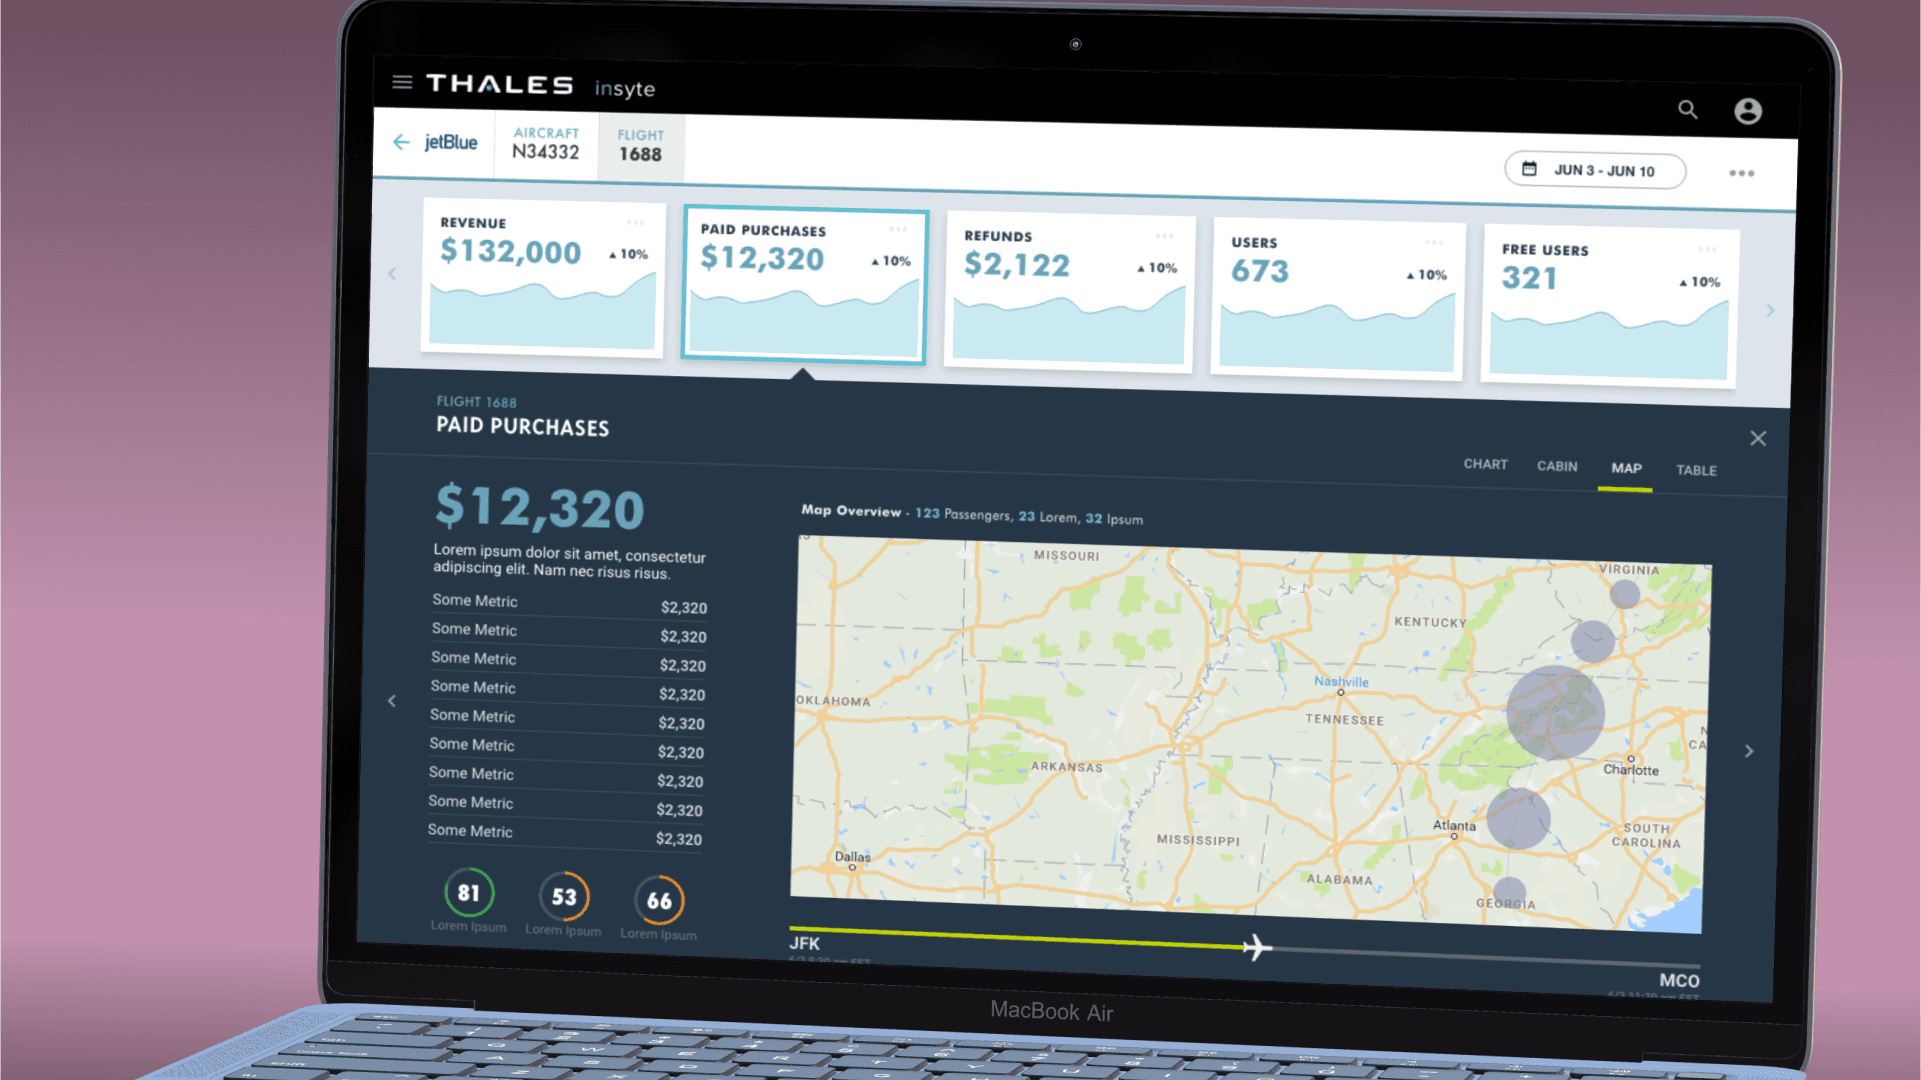
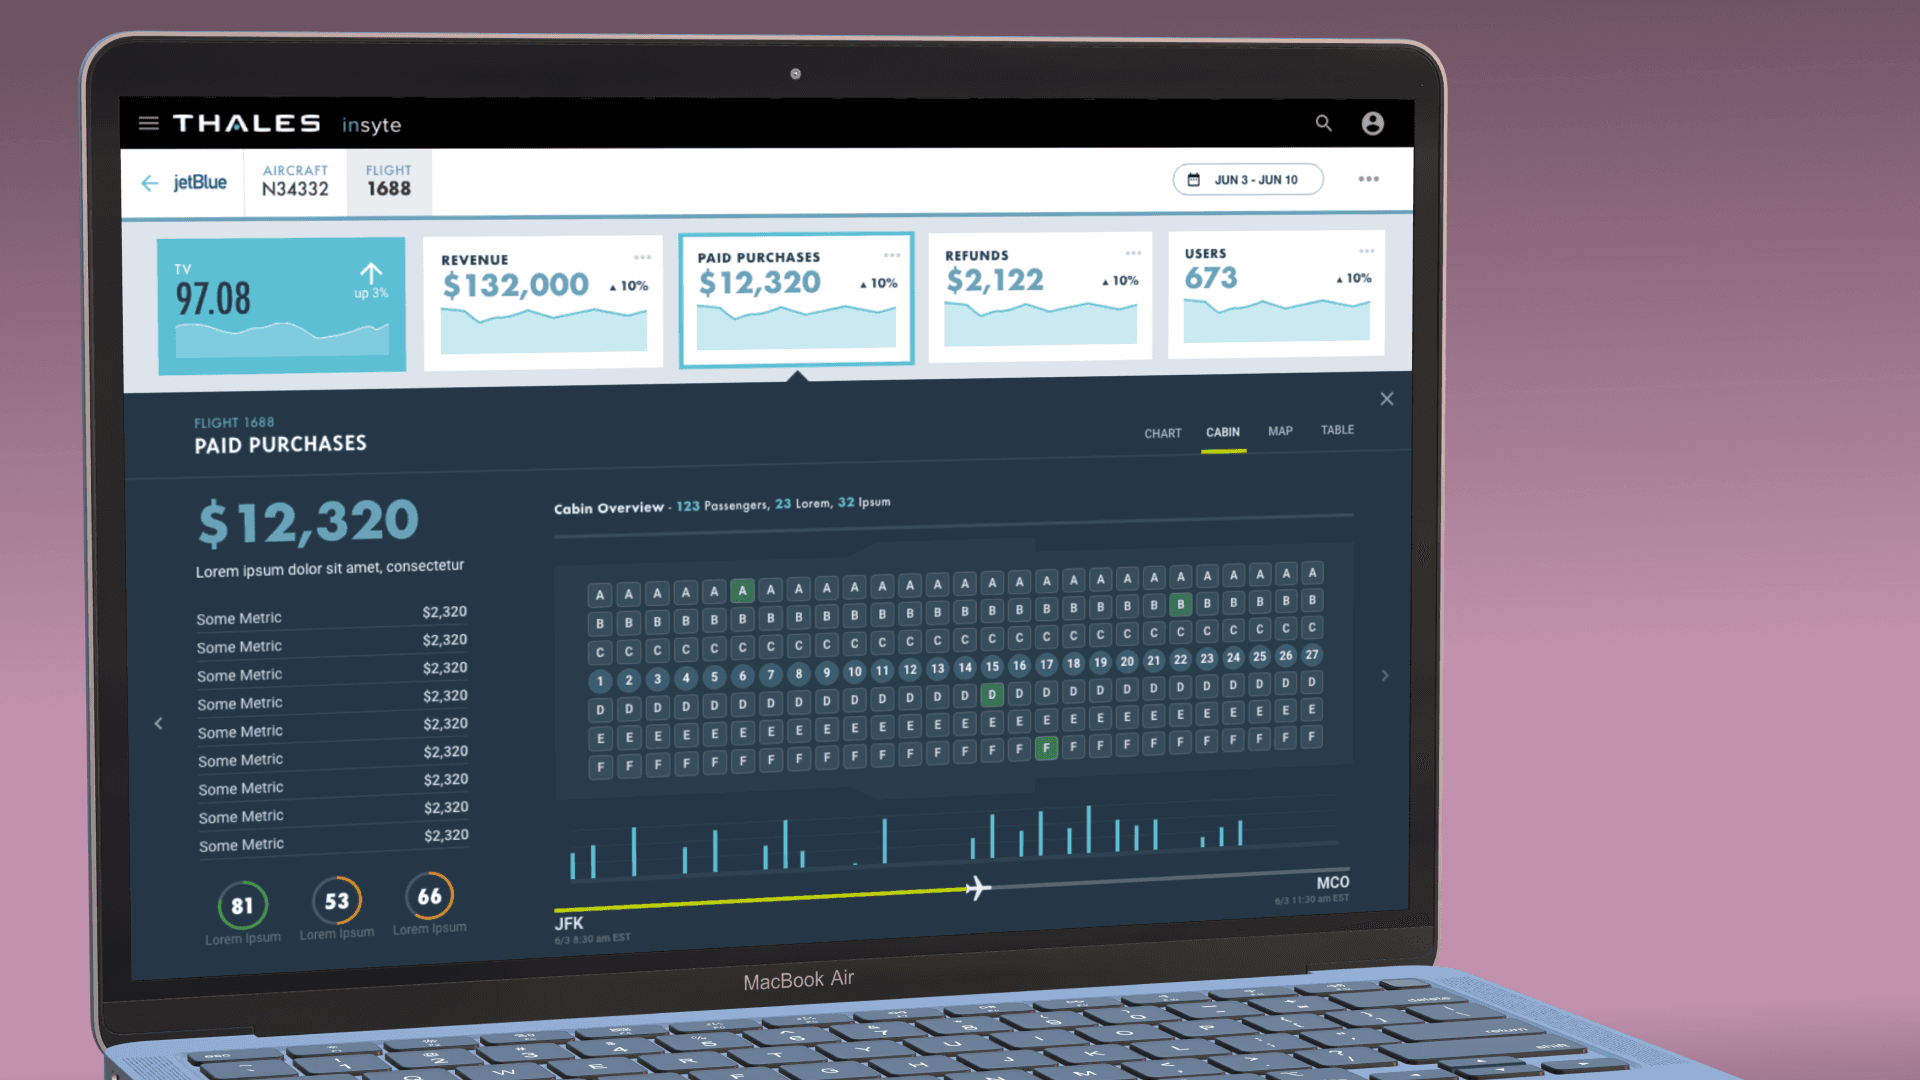
  • Progressive Disclosure: Data unfolds from high-level summaries to deep dives, using drawers and tabbed sections for optimized space.

  • Customizable Views: Toggle between panel and grid views to suit monitoring needs.

  • Alert System: Proactive alerts allow fast issue resolution.

As lead UI/UX designer, I conducted research and designed a user-centric dashboard interface that streamlined administrators' decision-making through clear, actionable data insights and efficient space utilization.